The 2019 Atlantic hurricane season was a very active hurricane season, more active then 2017 and 2005. The season featured 26 depressions, 18 storms, 10 hurricanes, and 7 majors. The season was a medium La Nina in the Atlantic, making waters warmer.
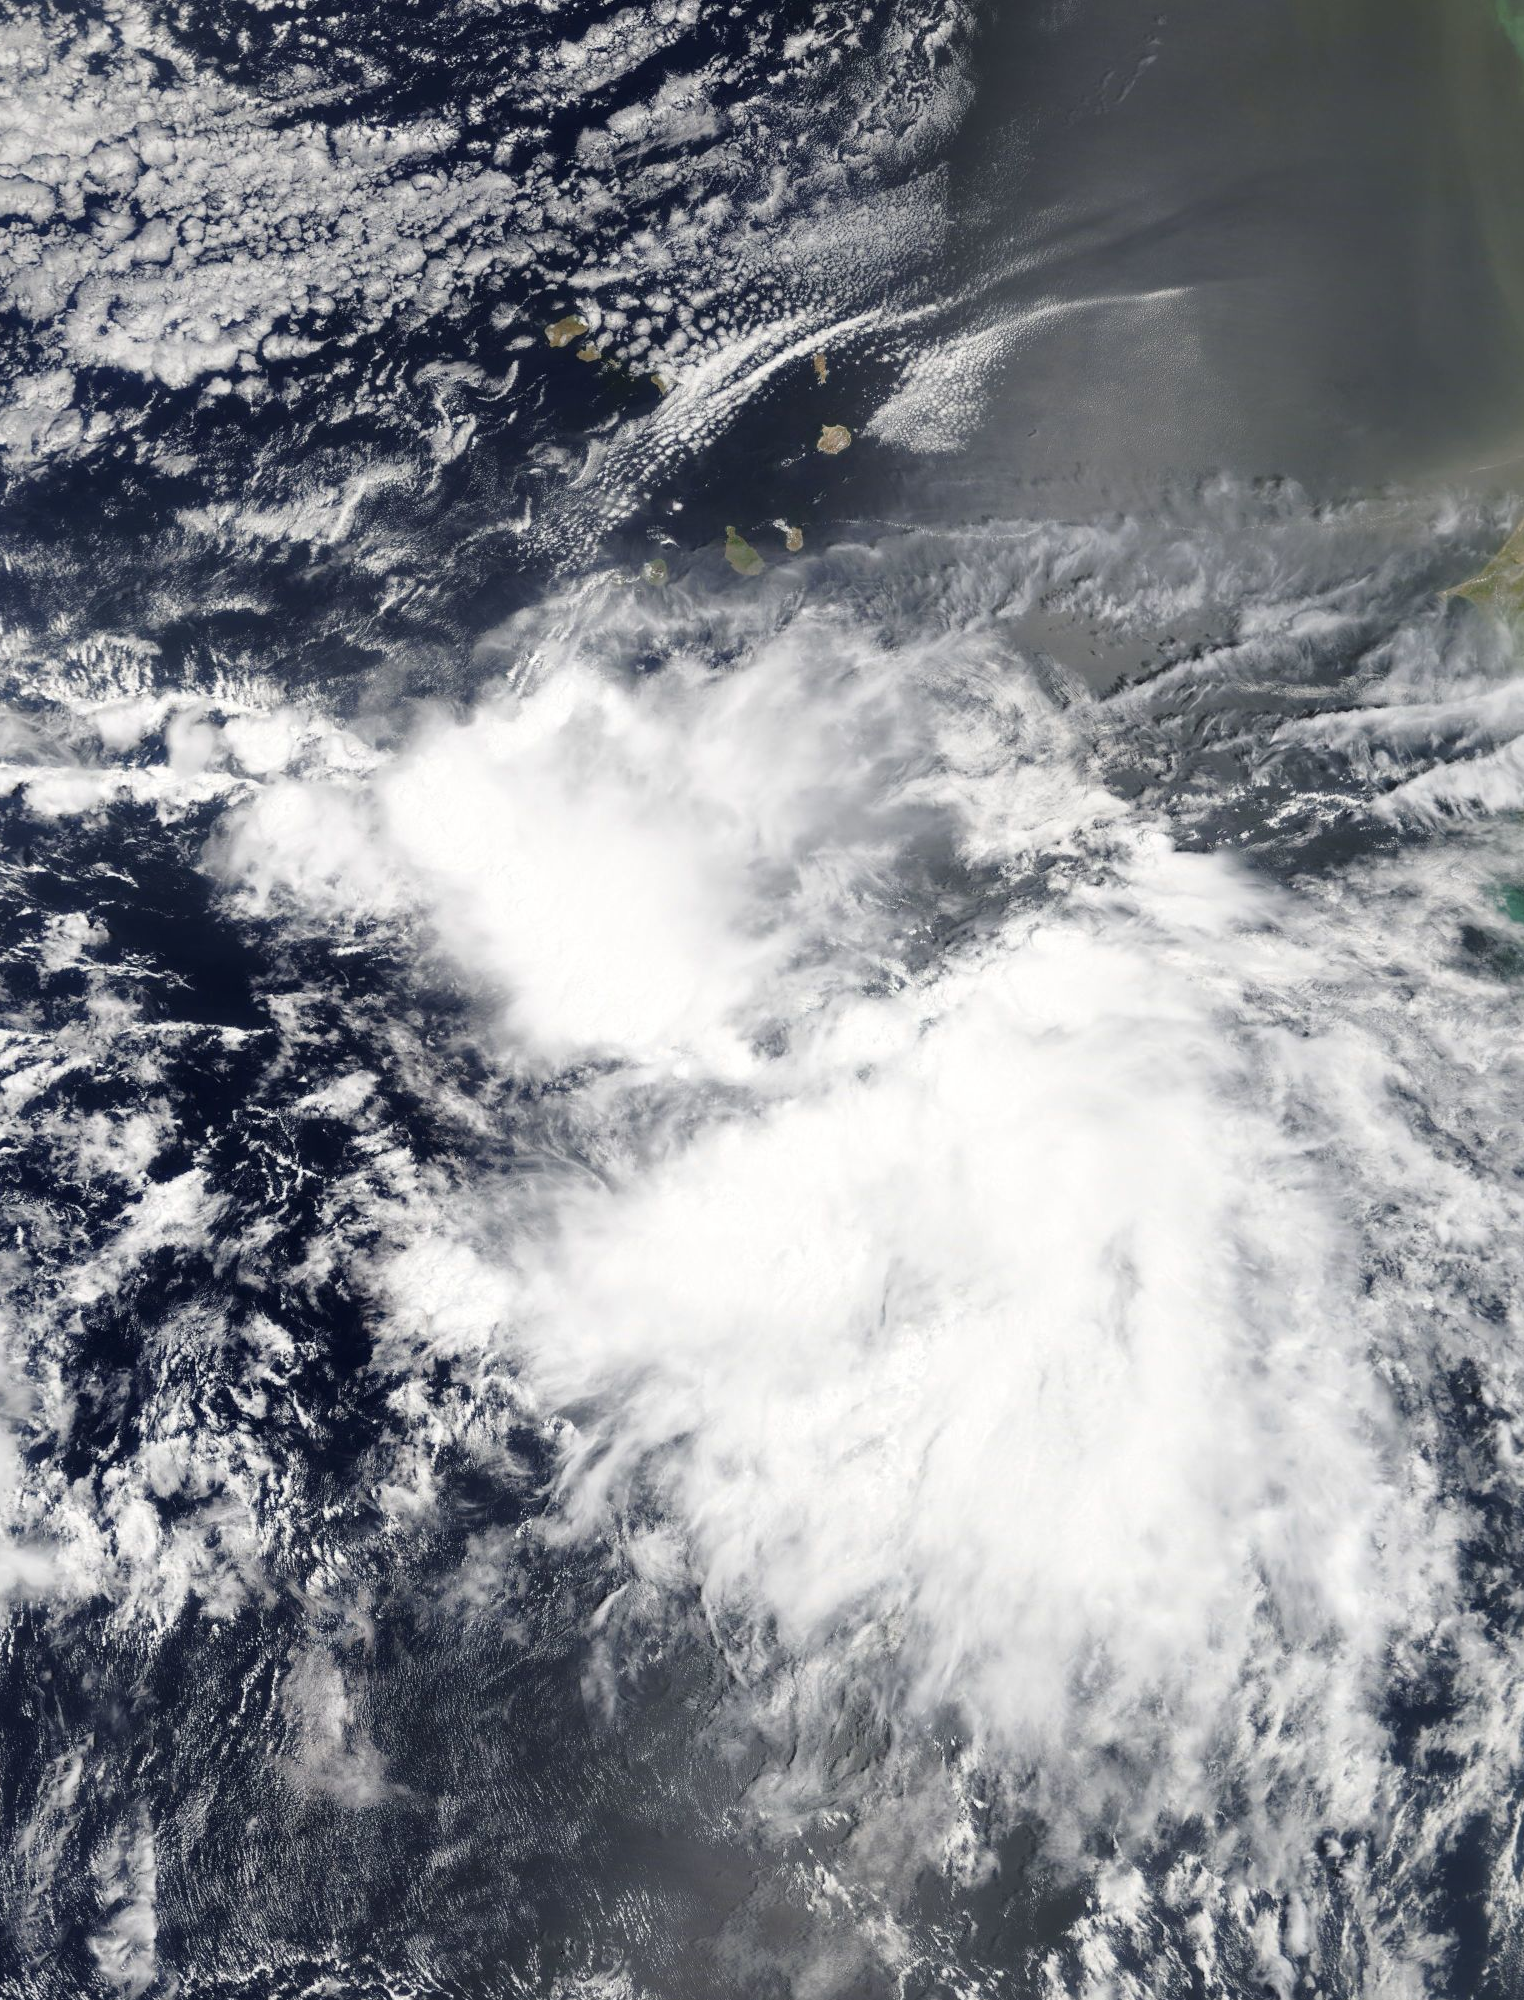
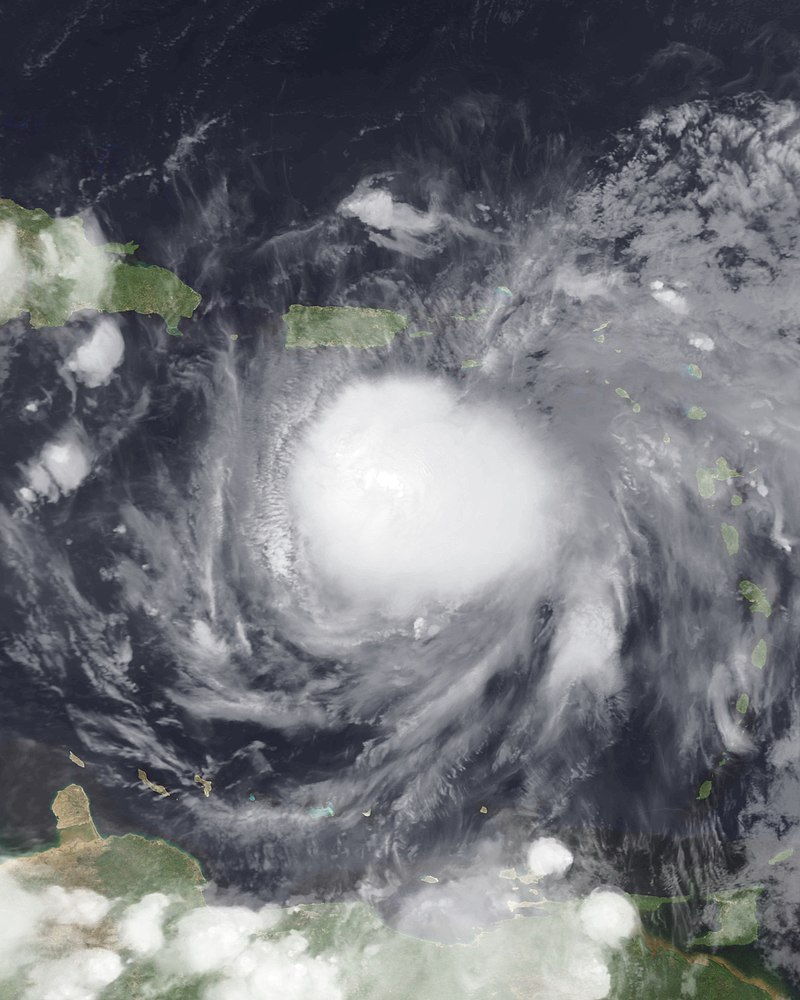
A area of disturbed weather was highlighted by the NHC 3 days after the offical start of the 2019 Atlantic hurricane season. The disturbance crossed over the Cape Verde islands and brung 3 inches of rain in the Cape Verde islands. The disturbance was disorganized going over Cape Verde, with no significant signs of development over the next 48 hours. The disturbance made a cyclonic loop, back to Cape Verde to make another landfall there. The disturbance swiftly crossed over the middle of the Atlantic ocean, not making any development. The disturbance strengthened into a Invest near the Lower and Upper Antilles, having a 60% chance of development to strengthen into Tropical Depression One. The invest made a loop over the Upper Antilles to a patch of 90F waters, which upgraded the invest into Tropical Depression One. One made another loop to the Upper Antilles, and crossed over to low wind shear, which caused the storm to intensify fast over the next 24 hours. The storm had a spin pattern, which hurricane hunters flew inside the storm to see if any changes to the weather. There was a patch of tropical storm winds on the middle part of the storm, which made the NHC classify it into a tropical storm, and gave it the name Andrea. Andrea started to cross over the Antilles, causing minor damage to the islands and flooding up to 2 inches. Andrea weakened into a tropical depression, and rapidly moved fast, weakening over the days until it made a final landfall on the Yucatan as a remnant low, causing minor flooding and damage. The storm swiftly went over Mexico and fully dissipated on June 8. The remnants of Andrea moved over the United States, causing heavy rain and flooding over the Mid-West and the west coasts of California and Oregon.
Andrea caused significant damage over Cape Verde as a disturbance, with 5 inches of flooding from 2 inch rain pouring on the islands. The damages on the Antilles were minor, with some debris flying on houses and breaking windows, and 2 inch flooding flooded garbage cans and recycle bins. Damages in the Yucatan were also minor, but more flooding, with 4 inch flooding from the coast of the Yucatan and 2 inch flooding on the other Yucatan parts.
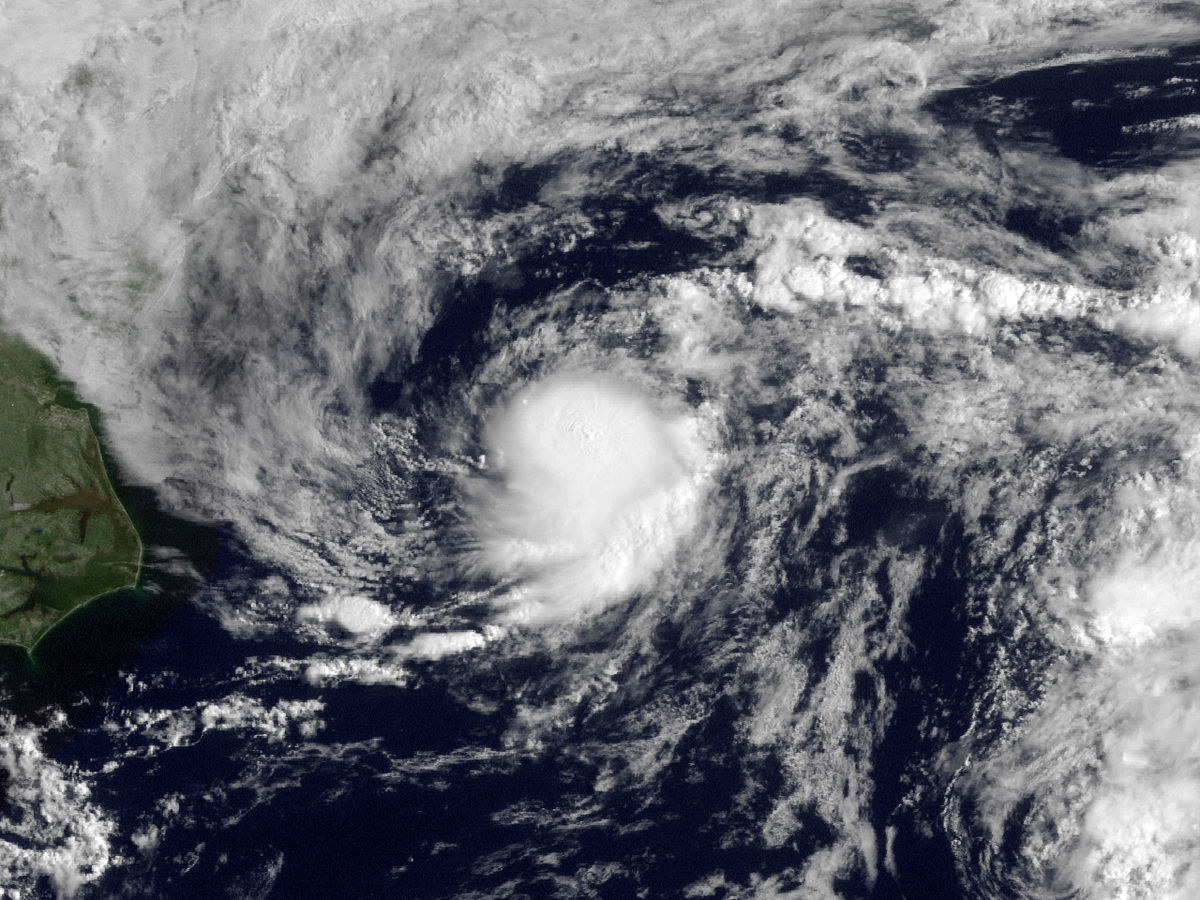
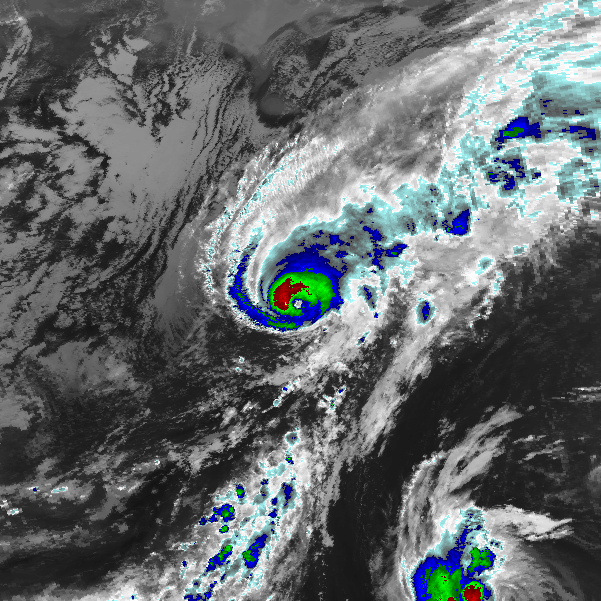
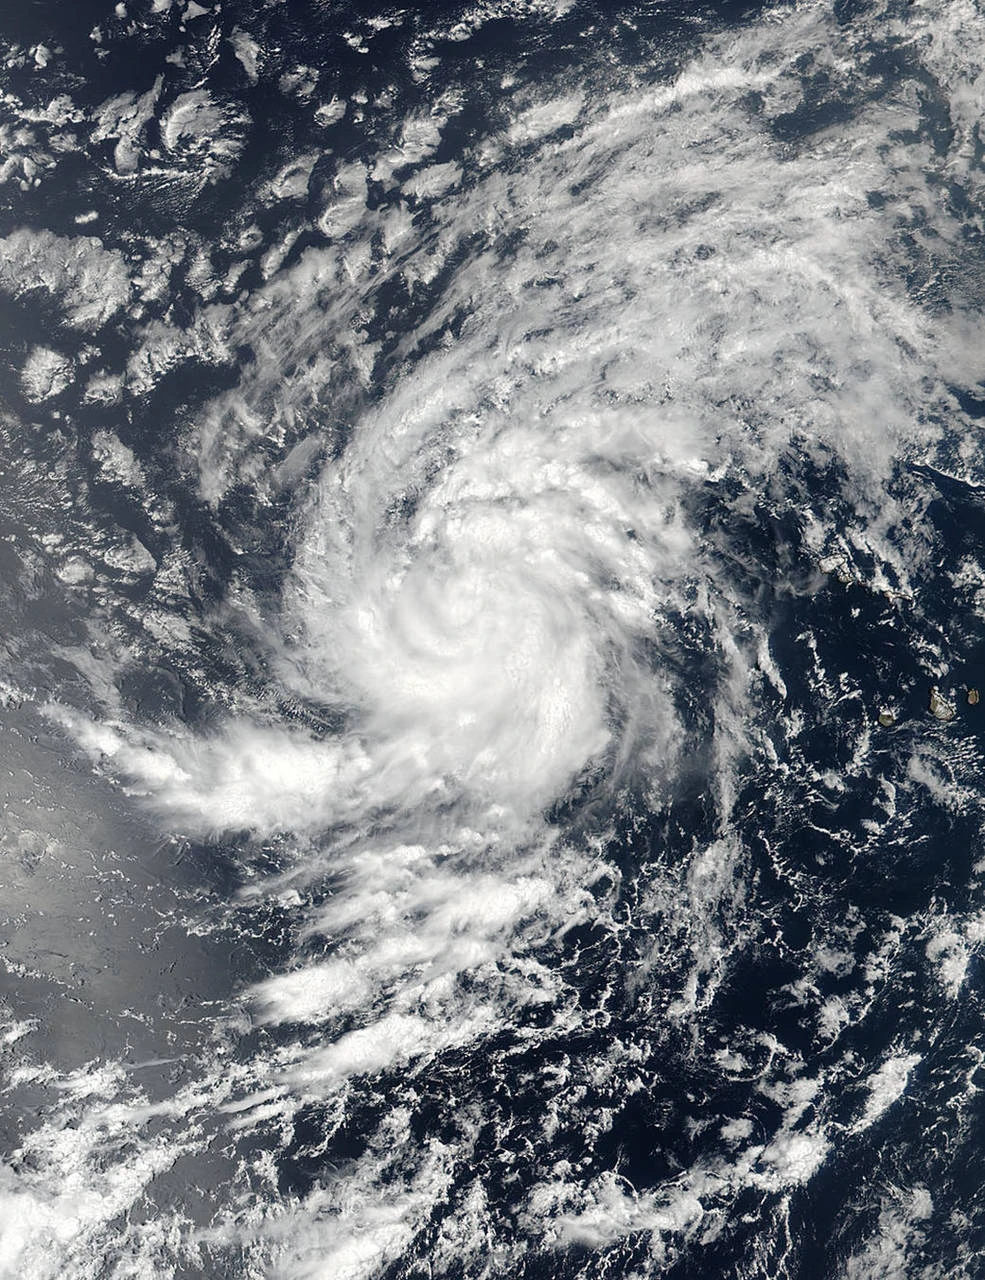
During Tropical Storm Andrea, a tropical wave formed off the coast of Africa, just north of Cape Verde. The wave was large, but organized, so the wave had no struggle to intensify into a invest 48 hours after emerging from Africa as a wave. The invest slowly intensified into a depression, but weakened into a weak invest. The invest had a 40% chance to form into Tropical Depression Two. A convection burst hit the young invest, and the invest rapidly intensified into Tropical Depression Two 48 hours after being classified into a invest. The depression tracked northward, not affecting any land in its path, and deepened near Bermuda. One reached a peak intensity of 25 mph, despite the depression deepening and struggling in high wind shear. Due to high wind shear, the depression couldn't reach 30 mph or higher. The bad weather of One is getting pushed into Bermuda, causing floods and heavy rains in Bermuda, as well as very little debris flying around during the storm. The depression made a cyclonic loop towards Bermuda, and made a landfall on the northwest coast of Bermuda, before moving upwards into 50F waters. The depression rapidly declined until dissipating on June 10. The remnants of Two affected the Atlantic coast of the United Kingdom.
Two was a nuisance to the North Atlantic basin, but it did pack a punch as remnants over the United Kingdom. The remnants of Two had tropical storm gusts and 6 inch rainfall pouring on the west coast of the United Kingdom.
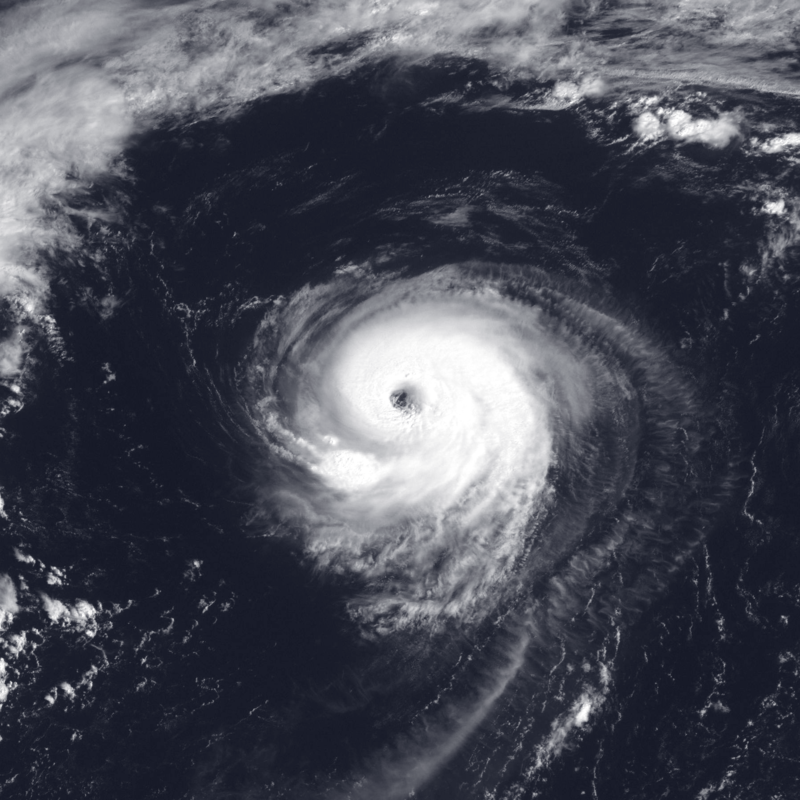
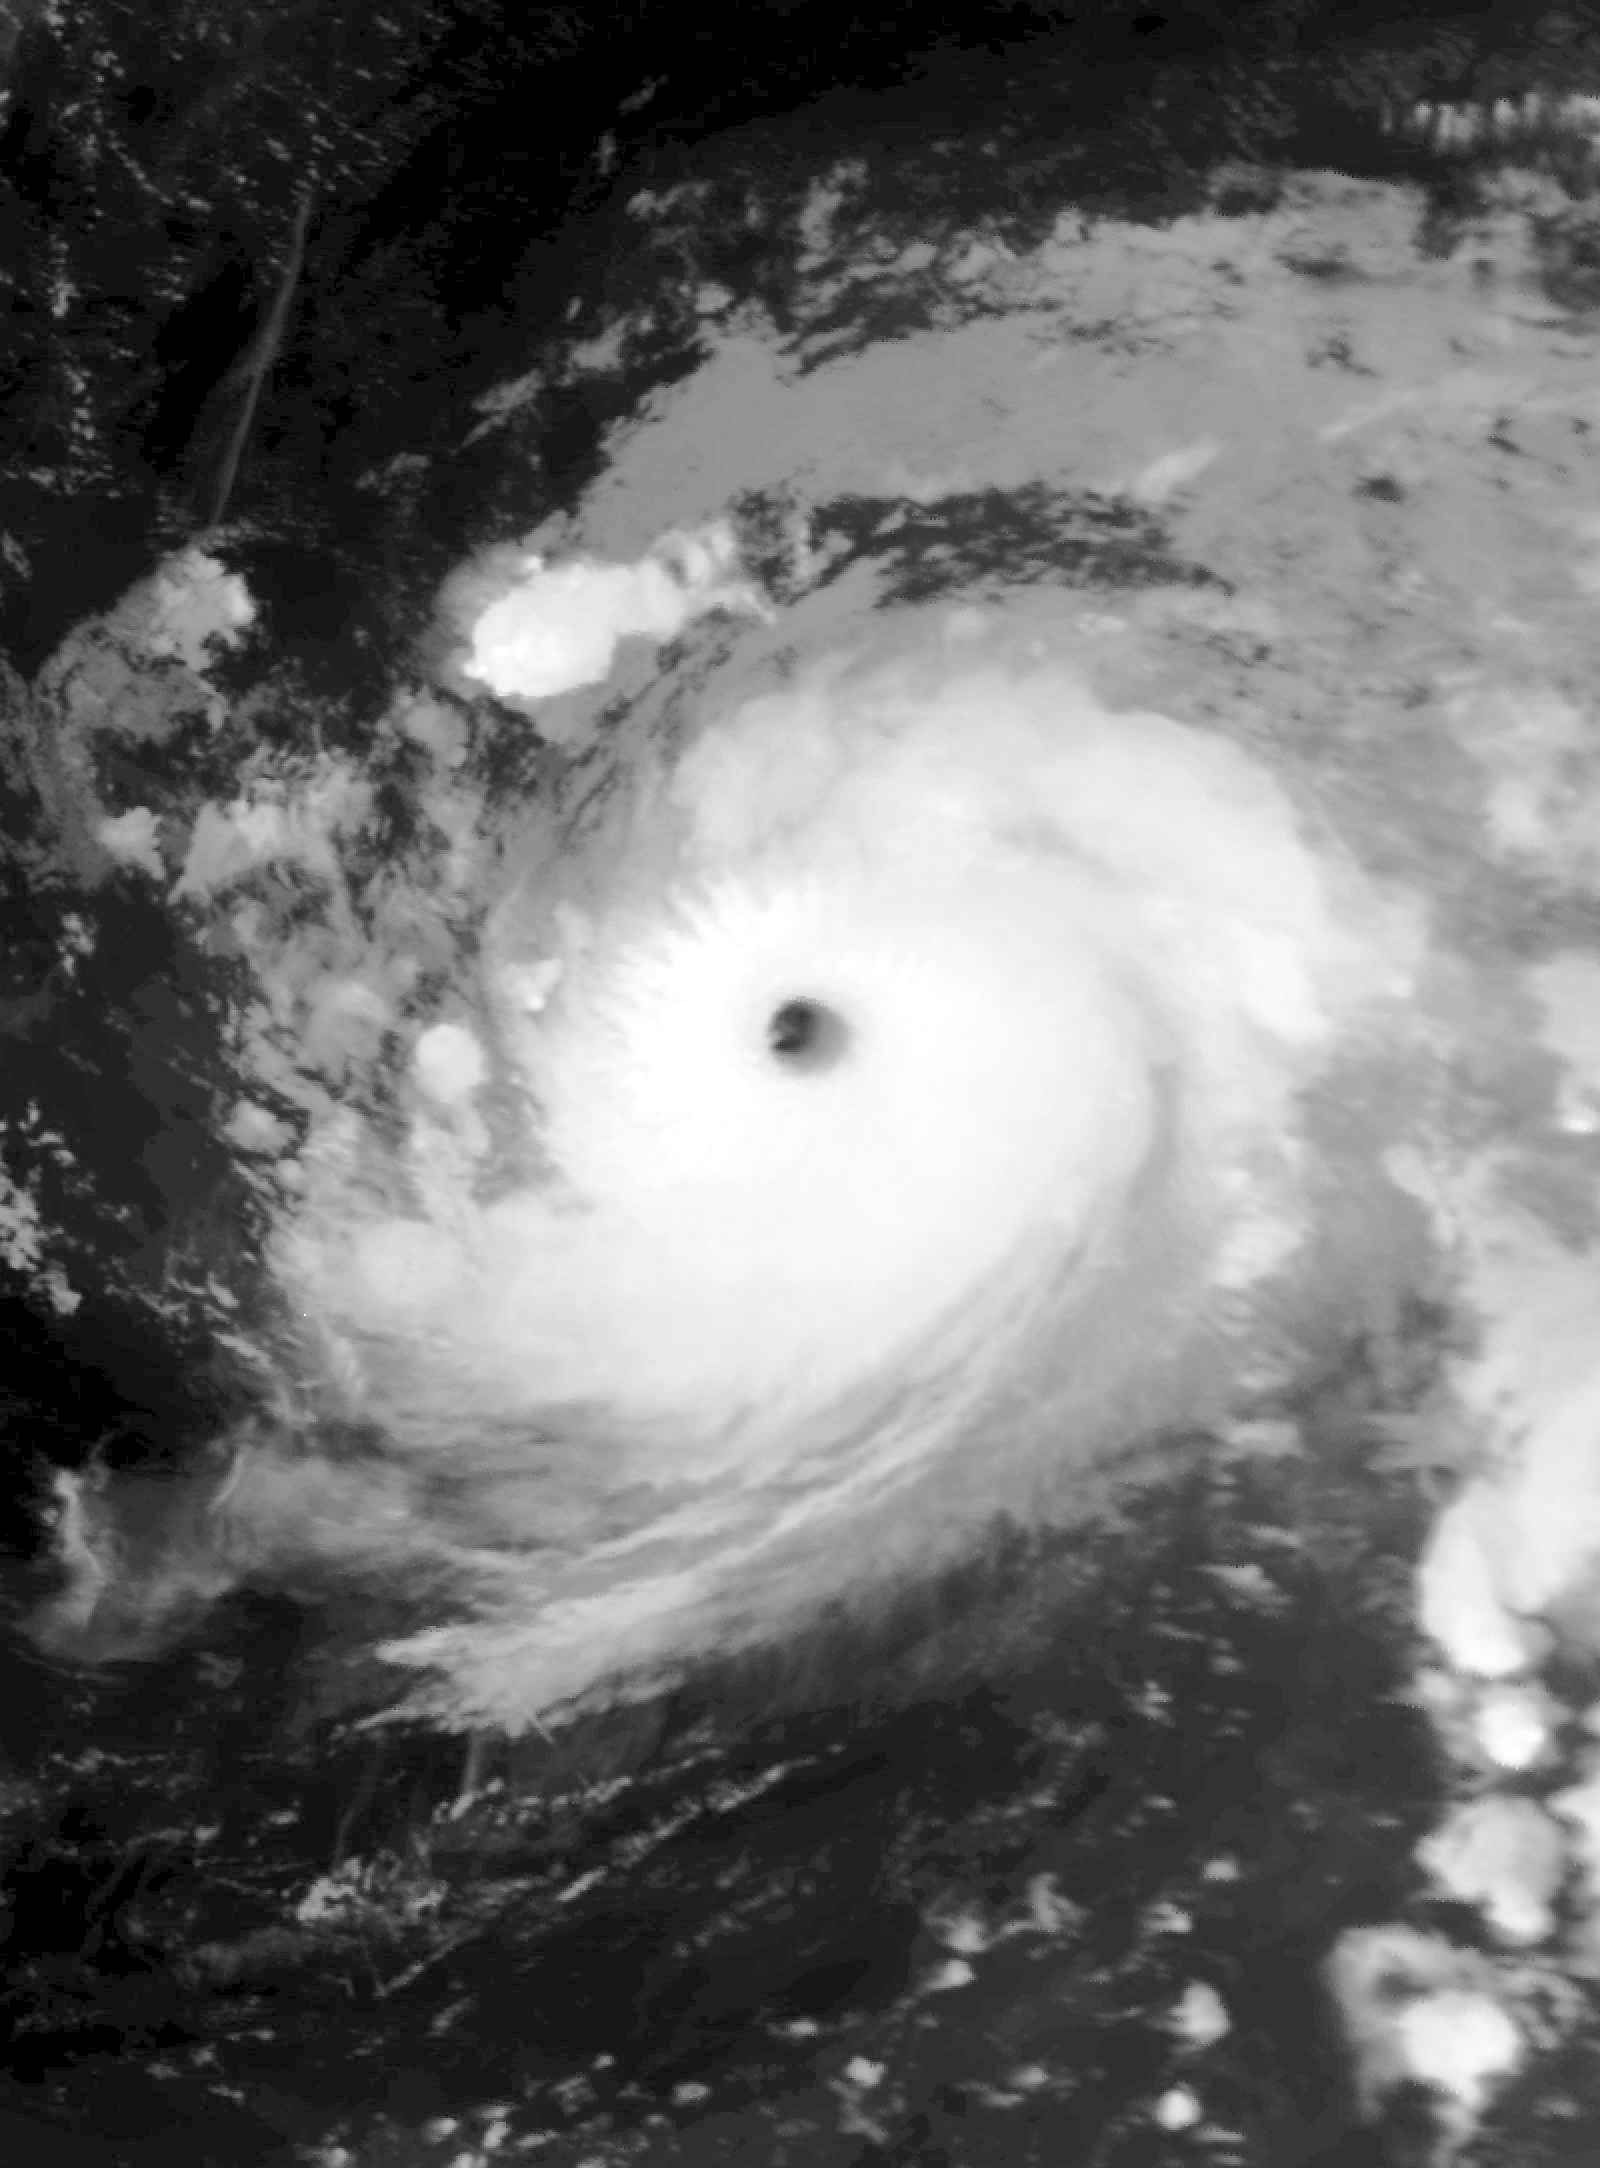
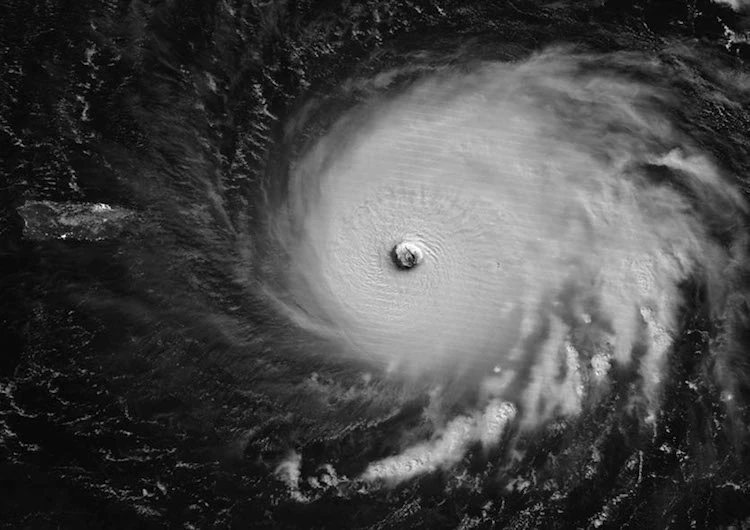
A area of disturbed weather was highlighted first by the NHC before emerging of the coast of Africa, when the wave was scattered storms. The wave emerged off of Africa 3 hours later, and was disorganized by the times of emerging off of Africa. The wave entered more favorable areas, where the wave hit a burst of convection, upgrading the storm into Potential Cyclone Three, and the NHC issued advisories for the potential cyclone. The potential cyclone entered the Main Development Region, which caused the potential cyclone to be upgraded into Tropical Depression Three just 3 days after being a potential cyclone. Three curled southwestward, heading to the Upper Antilles and the US Virgin islands. The depression deepened, causing a low pressure of 985 mbar, the lowest pressure a depression could get. The depression under went rapid intensification, classifying the depression into a category 1 hurricane on 17:00 UTC and gave it the name Barry. Barry went into more deepening, ending up with a pressure of 965 mbar.
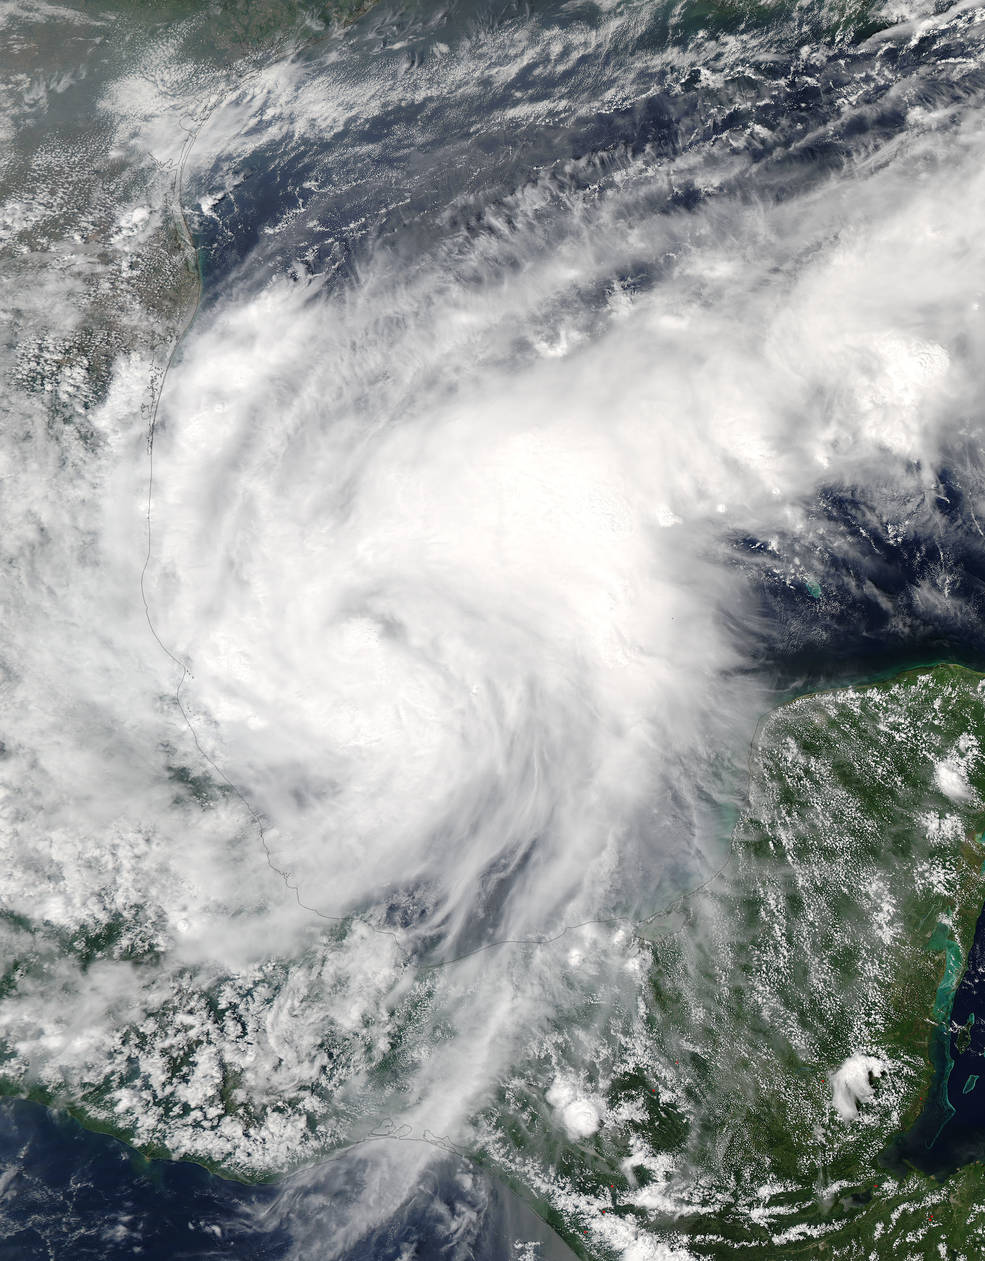
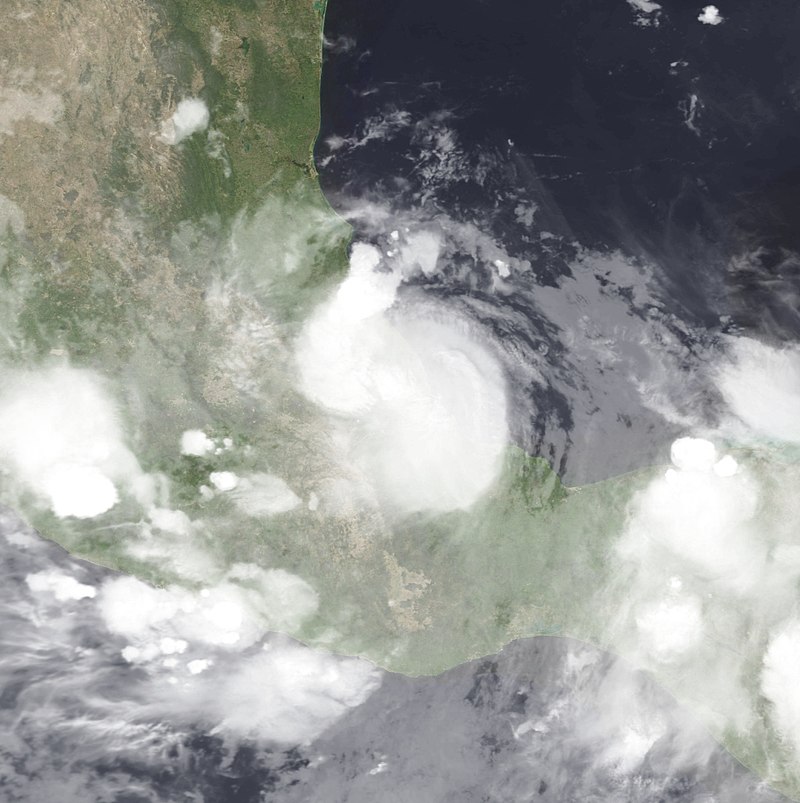
Barry hit a peak of winds of 80 mph, moving out of the Upper Antilles, and into the Gulf of Mexico, where strengthening was common. Barry moved southwestward, into Veracruz, a hurricane prone area. The NHC issued a watch for Veracruz, as Barry is moving into Veracruz. A barometric pressure recorded was 963 mbar moving into Veracruz, making Barry a intense category 1 storm.
Barry weakened back into a tropical storm after nearing Veracruz, but restrengthened into a category 1 hurricane with 75 mph winds and a barometric pressure of 968. Barry made landfall in Veracruz on 15:00 UTC, June 16, causing significant damage across the state of Veracruz. Barry started to burstly weaken after crossing Veracruz, leading to a dissipation on June 17 in the East Pacific. The remnants of Barry made a tropical wave in the East Pacific.
Barry caused significant flooding of 6.3 inches of flooding and had rains estimated of 12.5 inches of rain across Veracruz, and 3 inches of rain across the entire country of Mexico. Although the damages estimated about $13 million, Barry did have impact with remnants with about $500 million dollars of damage across its remnants absorbed by another storm.